
What’s Changed: 2018 Gartner Magic Quadrant for Analytics and Business Intelligence Platforms
-
 By
Tim King
, Executive Editor at Solutions Review
By
Tim King
, Executive Editor at Solutions Review - Business Intelligence News, Staff Pick,
Analyst house Gartner, Inc. has officially released its 2018 Magic Quadrant for Analytics and Business Intelligence Platforms. The report describes ‘modern’ analytics and BI buying as mainstream, with cloud-based deployments increasingly becoming the norm. We expect the term ‘business intelligence’ to die-off in the near term, as organizations move beyond antiquated jargon and legacy tools, paving the way for artificial intelligence and automation to take over. It’s one of the reasons we believe Gartner flipped the words ‘analytics’ and ‘business intelligence’ in the title of this report.
Gartner highlights augmented analytics as a strategic planning topic, a paradigm that includes natural language query and narration, augmented data preparation, automated advanced analytics, and visual-based data discovery capabilities. These features will be commonplace in the space during the next several-year period, so much so that they will be included in 90 percent of available products.

Gartner characterizes a modern analytics and BI platform as “easy-to-use tools that support a full range of analytic workflow capabilities.” These tools “do not require significant involvement from IT to predefine data models upfront as a prerequisite to analysis, and in some cases, will automatically generate a reusable data model.” With that said, analytics and BI tools may be optionally sourced from traditional IT-led data structures to promote governance across an organization.
Ironically, Gartner notes that much growth in this market used to be driven by business users through small purchases in individualized business units. Market maturity has driven that responsibility back into the hands of IT as a way to expand self-service functionality. And though ‘modern’ analytics and BI remains the industry standard, the ideal for adopters, according to Gartner, is that traditional capabilities be integrated into emerging frameworks.
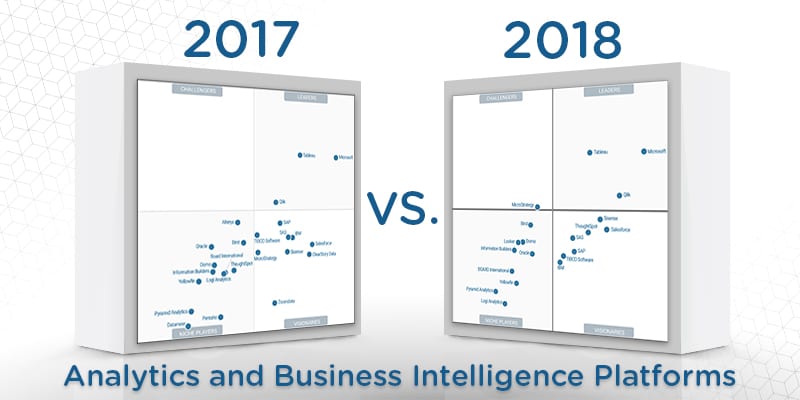
In this Magic Quadrant, Gartner evaluates the strengths and weaknesses of 20 providers that it considers most significant in the marketplace, and provides readers with a graph (the Magic Quadrant) plotting the vendors based on their ability to execute and their completeness of vision. The graph is divided into four quadrants: niche players, challengers, visionaries, and leaders. At Solutions Review, we read the report, available here, and pulled out the key takeaways.
Looker is the only new provider in this year’s Magic Quadrant. A regular in the report for several years, Alteryx has been removed because Gartner analysts believe its product portfolio compliments rather than competes with the other included vendors. ClearStory Data and Zoomdata were axed because they no longer meet the criteria for inclusion, and Datameer and Pentaho were excluded because their market focus shifted.
As we forecasted earlier this month, Tableau and Microsoft continue to dominate the marketplace, offering unmatched portfolios that cover the “two modes” Gartner talks about in the report. Tableau offers perhaps the best set of data visualization capabilities in the marketplace, and Microsoft’s Power BI features an expansive set of deployment methods and feature capabilities for virtually every use case. Qlik rounds out the leaders in this iteration, with strong pursuit of market supremacy for the embedded use case.
The lone market challenger this year, MicroStrategy made a considerable leap from the visionaries bracket in 2017. The solution provider merges self-service data preparation and visual data discovery in an enterprise product. The company offers a rock-solid BI platform that is trusted in the enterprise sphere, and a new free desktop version of the platform is a great way for users who are curious about the tool to give it a try.
Sisense, ThoughtSpot, and Salesforce make up the class of the market visionaries column this year, with each provider nearing the border between themselves and the leaders. Sisense offers an integrated analytics and BI platform that covers the entire workflow, and the company released Sisense 7 in October. We would not be surprised to see Sisense make the jump into the leaders bracket in 2019. ThoughtSpot made perhaps the biggest leap of any provider in this report, and Gartner explains that its search-based interface and newly minted SpotIQ help it to differentiate itself from the pack.
SAP, TIBCO Software, and IBM all make their homes in the middle, left-hand side of the visionaries quadrant this year, with each provider seeing positional regression from 2017. SAP and IBM continue to lag as a result of their slow-moves to modern analytics and BI. TIBCO scored well for its product in decentralized use cases, but lower customer reference marks for sales experience and operations limit its upside relative to the market leaders.
Birst and its cloud analytics and data management platform are tops in the niche players column. Birst is unique because it allows customers to choose their own database for the analytics schema. Making its debut, Looker overlaps with Domo just slightly below Birst, but in a strong position to upgrade its standing for 2019. As Gartner notes, Domo has some of the largest venture capital reserves of any technology startup in the world. Domo is one of the top providers for ease of use functionality, and the vendor is closing capabilities gaps with some of the larger names in the space.
Information Builders, BOARD International, and Oracle remain in the upper-half of the niche players bracket, and none of the providers moved much. Information Builders offers traditional to modern reach, and the company recently nabbed a growth equity funding round from Goldman Sachs. BOARD International serves a niche sub-market for centralized BI and corporate performance management platforms. The company also touts strong customer perception and considerable growth in the US market.
Yellowfin, Pyramid Analytics, and Logi Analytics round out the lower-third of the niche players quadrant. Placement aside, Pyramid Analytics features a broad range of use cases and recently unveiled Pyramid 2018, a server-based, multi-user analytics OS that touts self-service functionality. Looker offers its own data modeling language (LookML) and products that support a wide range of use cases. Looker raised more than $81 million in March, and most recently updated its self-service portfolio for non-technical users. Logi Analytics is most-known for its embedded analytic capabilities, hampering its ability to stake claim among the other mainstays in the marketplace. Logi Analytics was acquired by Marlin Equity Partners in November.
To turn your organization into a veritable treasure trove of analytic insight, avoid the five most obvious pitfalls.
Related:
- Side-by-side BI and analytics product comparison guide
- 5 Business Intelligence and Data Analytics Vendors to Watch in 2018
- What’s Changed: 2018 Gartner Magic Quadrant for Data Management Solutions for Analytics
- What’s Changed: 2018 Gartner Magic Quadrant for Data Science and Machine-Learning Platforms
- What’s Changed: 2017 Gartner Magic Quadrant for Business Intelligence and Analytics Platforms
- Top 5 Questions to Ask When Evaluating BI & Data Analytics Software

Tim King
Executive Editor
Tim is Solutions Review's Executive Editor and leads coverage on data management and analytics. A 2017 and 2018 Most Influential Business Journalist and 2021 "Who's Who" in Data Management, Tim is a recognized industry thought leader and changemaker. Story? Reach him via email at tking@solutionsreview dot com.
- Analytics and Data Science News for the Week of April 12; Updates from Alteryx, MicroStrategy, Starburst & More - April 12, 2024
- Analytics and Data Science News for the Week of April 5; Updates from Databricks, Qlik, Salesforce & More - April 4, 2024
- Analytics and Data Science News for the Week of March 28; Updates from Databricks, MicroStrategy, Qlik & More - March 29, 2024