
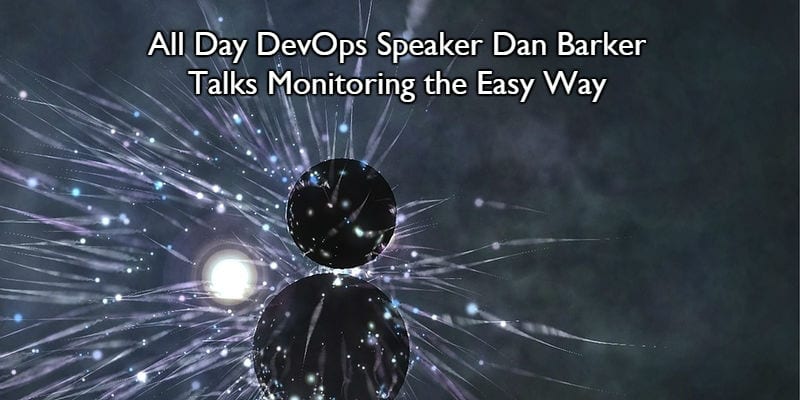
All Day DevOps: A Look at Monitoring the Easy Way With Daniel Barker
Cloud computing events are invaluable for learning the latest tips and tricks of the space. Unfortunately, many of us can’t attend events due to location or costs. To alleviate this struggle, All Day DevOps was created. This online conference takes place of 24 hours with 112 sessions for free! Each session led by industry professionals in a variety of areas.
To help kick this event off, we connected with Daniel Barker to learn more about his upcoming speech, Monitoring the Easy Way. Daniel currently works as the Chief Architect at the National Association of Insurance Commissioners. He also leads the technical and cultural transformation for the NAIC. NAIC focuses on consumer protection in the insurance industry. We cover various forms of monitoring so we’ll definitely be tuned in! Read more about Dan at the bottom of this post.
Briefing on Monitoring the Easy Way
The technology industry has recently decided to move from the word monitoring to the word observability. In some cases, this is likely a bit of a marketing gimmick, however, it is quite important. It takes the industry a little closer to its academic roots like so many other modern implementations of academic literature from the 1970’s. So, what is observability?
Observability isn’t just a marketing term; it’s a component of control theory. If you want a quick primer, this video might be helpful. Basically, observability means that you can estimate a particular state of a system based on an output. More generally, a system’s state should be deterministic from its outputs. Controllability, the mathematical dual of observability, of a system requires that a system state be determined by the inputs to the system.
This is a fairly simple concept, but it’s very challenging to put into practice. In a sufficiently complex system, it may be nearly impossible to implement full observability. However, you should strive to get the right outputs that allow you to determine the system’s state, especially when you encounter a failure mode.
It’s becoming easier and easier to install and operate the tools necessary. Istio is helping to drive this change, particularly for older applications. It can be very hard to implement tracing and metrics in some older applications, but Istio provides a forward and reverse proxy for older applications that can produce both metrics and tracing data. Istio can do more than that, but just this increased visibility will make it valuable to organizations with legacy systems they don’t wish to upgrade.
Prometheus is a metrics aggregation system that is very easy to get running on Kubernetes. The Prometheus Operator from CoreOS/Red Hat makes installing and maintaining Prometheus and its companion Alertmanager nearly trivial. We’ll walk through this during my session and show how you can configure multiple versions at once to test your upgrades and explore differences.
Wait, what’s an Operator? I thought those went away years ago. An Operator is a pattern for codifying operational knowledge into Kubernetes primitives and allowing interactions with this pattern as a first-class citizen by using Kubernetes tools like kubectl or Helm. I have previously covered this topic at BSidesKC.
The last tool we’ll be discussing during my session is Jaeger. This tool was created by Uber Technologies a couple years ago. It uses the OpenTracing standard to implement its traces, which Istio gives you without making any additional changes. OpenTracing is a Cloud Native Computing Foundation project, that isn’t tied to Jaeger or any other tracing system, which makes your code and infrastructure highly portable to new tools. Jaeger is one of the best tools in this space. It has a lot of features that really help it scale to high volumes of data. It also has an interface that is easy to move around and discover insights.
We’ll be deploying Jaeger using an operator as well, which is becoming an increasingly common pattern. A year ago I was using Helm for this process, but now it seems everything is getting its own operator. However, many of these operators are starting to be deployed by Helm, which makes that process a little easier, but the lines of control need to be clear so users don’t get confused as to which tool controls which aspects of the deployment. Often in these systems it can become easy to get into circular dependencies that require some method for bootstrapping from scratch, so don’t forget that important step.
If you want to learn more about these tools and concepts, then check out my talk at All Day DevOps on October 17th, 2018. Also, I cover more on observability and several related tools in my new eBook published by Opensource.com.
About Daniel Barker
Dan spent 12 years in the military as a fighter jet mechanic before transitioning to a career in technology as a Software/DevOps Engineer/Manager. He’s now the Chief Architect at the National Association of Insurance Commissioners. He’s leading the technical and cultural transformation for the NAIC, a non-profit focused on consumer protection in the insurance industry. Dan is also an organizer of the DevOps KC Meetup and the DevOpsDays KC conference.
Doug Atkinson
An entrepreneur and executive with a passion for enterprise technology, Doug founded Solutions Review in 2012. He has previously served as a newspaper boy, a McDonald's grill cook, a bartender, a political consultant, a web developer, the VP of Sales for e-Dialog - a digital marketing agency - and as Special Assistant to Governor William Weld of Massachusetts.
- Solutions Review Best of 2018: Top Container Security Articles - December 20, 2018
- Logicworks and AVANT Communications Announce Alliance - December 19, 2018
- A Look at the Container Lifecycle and How to Keep it Secure - December 14, 2018