An Introductory Guide to Data Discovery Tools: Past, Present and Future
-
 By
Tim King
, Executive Editor at Solutions Review
By
Tim King
, Executive Editor at Solutions Review - Best Practices,
Business intelligence solutions have traditionally required a team of experts and hefty IT involvement. Modern practices and technologies are disrupting how organizations do data analysis, and are speeding up the analytics process and making its findings more actionable. Data discovery is the prime example, and provides data and analytics leaders a way of exploring data. This can be done in a structured or unstructured manner depending on the user. Data discovery is helping the enterprise lose much of the bulk in finding and analyzing data from many sources.
Data discovery is a process that enables users to detect patterns in data by viewing it or applying guided advanced analytics to assist them. It involves a combination of business process and specialized software. These capabilities can be found in modern data analytics and business intelligence software. The word ‘modern’ refers to products that offer advanced data analysis functionality and not just traditional reporting and dashboards. While no standalone data discovery solution exists, software seekers can use a number of tools to enhance their complex analysis.
The 3 Pillars (or Steps) of Data Discovery
Each of these three process and product combinations make up the crux of data discovery, and can be initiated separately based on where your organization is with analytics.
Data Preparation
This process involves sorting, cleaning and consolidating data into a singular location to make managing it and analyzing it easier and more accurate. Data preparation generally involves correcting data errors, filling in incomplete data, and uniting data from multiple sources. It is largely used as as an analytics pre-processing step that allows for the transformation of data. Some BI software can help users enrich and standardize their data in scenarios where multiple values are used, and proper formatting is essential for data quality.
Data preparation is increasingly taken up by business users as they are able to provide context that IT often cannot. Just be sure to understand your data types and formats, include your outliers and come up with a way to verify the accuracy of the prepared data to ensure the properties hold up. While data preparation can be time-consuming and wasteful, it remains one of the most important aspects to the overall analytics process.
Visual Analysis
Once the data is prepared and organized in a fashion that makes visual exploration possible, users can take advantage of BI software to identify patterns, trends and outliers. There are a number of different visuals that can be used (depending on the data) to help enact this process, and users can manipulate data by interacting with a direct representation of it.
The process often involves going back and forth between data preparation and visual inspection. Think of it as a puzzle; you identify one puzzle piece as a possible fit. You then attempt to fit the piece and it doesn’t quite match with the pattern, so you throw it back and try another. Once the visual becomes stable and you’ve back-checked the data quality, you can then begin to run predictive models and advanced analytics against it.
Advanced Analytics
Uncovering trends and making predictions requires relevant data. This usually requires manual data mining of what can oftentimes be large data volumes. In order for data and analytics leaders to ensure that their instincts are correct, they first have to obtain a granular view in choosing which data they are going to analyze. Before the data can be analyzed, it has to be located and prepared.
Advanced analytic properties are present in many of the industry’s best BI products. These capabilities help to develop and refine views into different data types so that only the most relevant data is grouped together. This goes a long way in deciding whether a specific set of data will help the user answer a specific question. Predictive analytics takes this process a step further, and these models can create a simulation of future conditions.
While the accuracy and usability of predictive analytics is dependent on how granular the analysis is and the assumptions that are being made, predictive modeling is especially useful in a real-time environment where the data being analyzed is generated on a rolling basis.
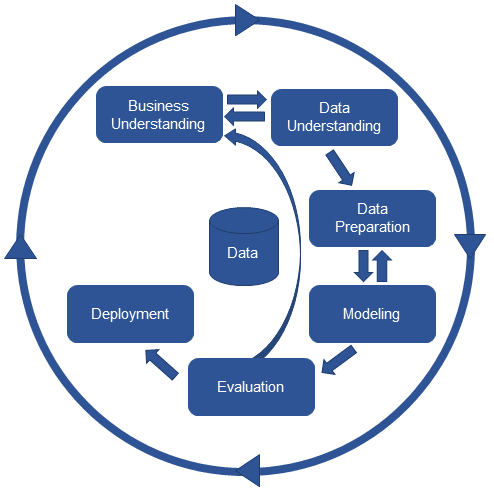
For the visual learners, here’s a basic chart that represents the steps in the data analytics process, from raw data all the way to evaluation and deployment. Data discovery is represented via the data preparation and modeling bubbles:
Search-Based Data Discovery vs. Visual Data Discovery
The two most commonly used data discovery processes are search-based and visualized. We touched a bit upon the visual aspect of data discovery in the previous section. Search-based data discovery involves the development of data views through text search terms. This method utilizes simple (think search engine) search to identify and guide users to relevant data. Both structured and unstructured data can be identified in this way, and search-based discovery will often provide users with a broad scope to uncover data. The user interfaces between search-based and visual discovery tools is often very different as well.
According to an entry in Gartner’s IT Glossary, search-based data discovery tools have three key features:
- A proprietary data structure to store and model data
- A built-in (RAM powered) performance layer that removes the need for aggregates, summaries and pre-calculations
- An intuitive interface that enables non-power users to explore data
Visual data discovery uses a variety of presentation types to speed up the process of uncovering relevant data. Users can explore data via dashboards, reports, charts and tables. Visual data discovery allows non-technical users to create more advanced and descriptive analysis than search-based tools do. It’s also a way for more experienced users to explore more than what’s included in standard charts and graphs in traditional BI.
The Next Generation of Data Discovery
Data discovery is being impacted by the same technologies as other core components of data analytics and BI software, and future processes and products will be shaped by AI and machine learning. The augmentation of data management and analytics will soon become mainstream for data discovery as well. Augmented data discovery utilizes new technologies to automatically find, visualize and narrate findings that may be of interest to specific users. These will include everything from correlations and exceptions to prediction.
Users will no longer be forced to write algorithms or write models, and this fact alone will really open the process of data discovery up to a large swath of users without specialized expertise. In addition to data visualization, users can explore data through the use of natural language processing-based narration and voice search (similar to what we discussed earlier with text search-based capabilities). Natural language query provides faster results and (in theory) less bias.
Data discovery has become a key component to modern data analytics software. Part of selecting the best BI software definitely involves evaluating each provider’s data discovery capabilities. Our popular Buyer’s Matrix Report can help you do just that, and compare the key features of each vendor in the data discovery tools marketplace.

Tim King
Executive Editor
Tim is Solutions Review's Executive Editor covering the human impact of AI on the future of work and learning. He is also the Media Strategist behind Insight Jam (1M+ on YouTube) events and programming. A 2017 and 2018 Most Influential Business Journalist and 2021 "Who's Who" in multiple categories, Tim is a recognized thought leader in enterprise tech and AI.
- Analytics and Data Science News for the Week of June 26; Updates from Databricks, Dataiku, WisdomAI & More - June 26, 2026
- Analytics and Data Science News for the Week of June 19; Updates from Databricks, Gartner, Qrvey & More - June 19, 2026
- Analytics and Data Science News for the Week of June 12; Updates from Databricks, Dataiku, Golden Analytics & More - June 12, 2026