The 20 Best Data Analytics Software Tools for 2019
-
 By
Tim King
, Executive Editor at Solutions Review
By
Tim King
, Executive Editor at Solutions Review - Business Intelligence News,

A 20-vendor compilation of the best data analytics software tools for 2019. All in an attempt to help you select the right product.
The marketplace for the best data analytics software is mature and crowded with excellent products for a variety of use cases, verticals, deployment methods, and budgets. Traditional business intelligence providers continue to offer dashboard and reporting capabilities that have remained staples to the market since the widespread adoption of data analytics began more than a decade ago. Disruptive newcomers are bringing new technologies to the table so that organizations can take full advantage of data.
Chief amongst these new use cases is data discovery, a technology that provides business users the ability to locate data that is relevant to a specific task. This capability can come in a variety of forms, but data source connectivity is a key attribute. Data preparation is also a major tenant of the modern BI platform. With end-user self-service a prominent focus for analytics vendors, providing organizations with the ability to discover and prepare data for analysis are important considerations.
There are very large providers we refer to as ‘mega-vendors’, like Microsoft, Tableau, Qlik, SAP, and IBM. There are also lesser-known innovators with interesting products that play in niche areas, such as ThoughtSpot,, Pyramid Analytics, and ClearStory Data. In an attempt to assist you with what can become a daunting task of selecting the right product, these are the top-20 best data analytics tools for 2019.

The Best Data Analytics Software Tools for 2019

Alteryx is a publicly-traded self-service analytics software company that specializes in data preparation and data blending. Alteryx Analytics allows users to organize, clean, and analyze data in a repeatable workflow. Business analysts find this tool particularly useful for connecting to and cleansing data from data warehouses, cloud applications, spreadsheets and other sources. The platform features tools to run a variety of analytic jobs (predictive, statistical, spatial) inside a single interface.
Specialties: Self-service, data blending, data preparation
Markets Supported: North America, EMEA, APAC
Key Features:
- Data preparation and blending: Alteryx Designer provides access to all relevant data by connecting to and cleansing data from data warehouses, cloud applications, spreadsheets and more.
- Scalable sharing and collaboration: Alteryx Server provides a flexible server architecture that can be deployed on-prem or in the cloud.
- Alteryx Connect contains a variety of data discovery tools. It allows users to work with metadata to better understand where data comes from and how it is being used.
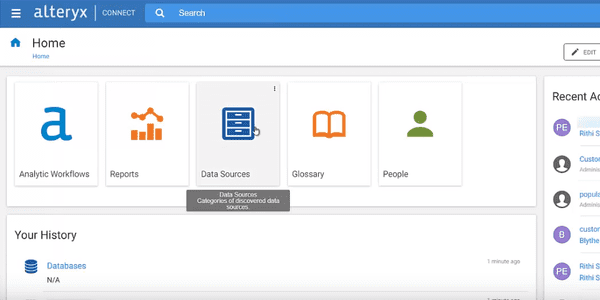
Source: Alteryx
For an even deeper breakdown of the best data analytics software, consult our vendor comparison matrix.

Birst offers a cloud-based analytics solution that connects an organization using a network of interwoven virtualized BI instances. The provider’s flagship product is its Networked BI platform. The tool features an adaptive user experience, multi-tenant cloud architecture, user data tier, and a completely virtualized data ecosystem. These capabilities enable use of BI across multiple regions, product lines, departments, and customers.
Specialties: Self-service, data warehouse architecture, agile BI
Markets Supported: North America, EMEA, APAC
Key Features:
- Adaptive user experience: The platform combines dashboards and data discovery into an integrated HTML5 interface.
- User data tier: Birst automates data unification and refining from any enterprise source.
- Multi-tenant cloud architecture: Birst can be deployed in the public cloud, AWS or the private cloud (as a virtual appliance) with the same code base, upgrade path, and support level.
Source: Birst
For an even deeper breakdown of the best data analytics software, consult our vendor comparison matrix.

BOARD combines business intelligence, performance management, and predictive analytics into one platform. As a result, any change to data, data models, security profiles or business rules is immediately propagated to every application. The solution provides all the tools required to create and update databases, data presentations, analyses, and process models. The company also offers BOARD Cloud, a SaaS version of the platform, backed by Microsoft Azure.
Specialties: Planning/forecasting, performance management, reporting
Markets Supported: Global
Key Features:
- Data discovery: Interactive search-based data discovery works across screens, data, metadata, and applications.
- Simulation: Users can translate business processes into sophisticated analytical models that enable users to assess the impact of decisions on their organization’s performance.
- Scorecarding: BOARD offers all the functionalities needed to translate company strategy into scorecards and strategy maps so organizations can communicate and roll out key objectives.

Source: BOARD
For an even deeper breakdown of the best data analytics software, consult our vendor comparison matrix.
![]()
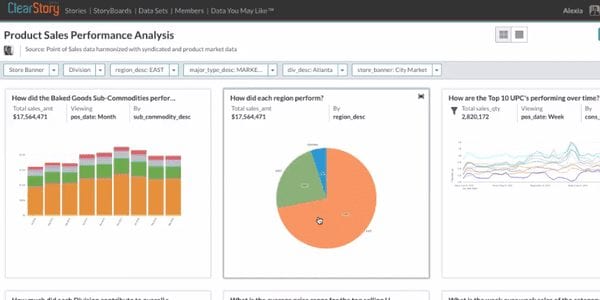
ClearStory Data’s flagship platform is loaded with modern data tools, including smart data discovery, automated data preparation, data blending and integration, and advanced analytics. The tool is delivered in the cloud and based off a Spark-centric distributed processing system. ClearStory connects to a wide variety of data sources, including structured and semi-structured data, cloud and web applications, Hadoop, and more. The company was recently awarded a US patent for smart data inference and harmonization.
Specialties: Data discovery, data preparation, data blending
Markets Supported: North America
Key Features:
- Automated data preparation: ClearStory’s Data Inference automates data preparation by intelligently inferring semantics inside data, reading values, and automating transformations.
- Smart Data Discovery: Smart Data Discovery allows users to instantly discover all data values, patterns, and correlations within a single data source or across blended data.
- StoryBoards: StoryBoards combine insights from one or more analysis in a storyline.
Source: ClearStory Data
For an even deeper breakdown of the best data analytics software, consult our vendor comparison matrix.

Datameer offers a big data analytics platform that utilizes the native query engines for Hadoop and Spark. The company uses Hadoop for both storage and compute. Datameer is a fully extensible solution that can integrate with existing data warehouse or business intelligence tools. The San Francisco-based vendor specializes in assisting organizations that invest in data lakes and other big data environments that support analytics for four main use cases: customer analytics, operational analytics, enterprise data warehouse (EDW) optimization, and fraud and compliance.
Specialties: Big data analytics, Hadoop analytics, data integration
Markets Supported: North America, EMEA, APAC
Key Features:
- Big data integration: Datameer connects to data from any source, manages how the data is accessed, and offers schema flexibility upon ingestion.
- Big data preparation: Datameer’s data preparation catalog features more than 270 functions, including extraction, text analytics, sessionization, and geo-location mapping.
- Big data governance: The multi-stage big data analytics pipeline uses secure data views and apply policies at every stage of the pipeline.

Source: Datameer
For an even deeper breakdown of the best data analytics software, consult our vendor comparison matrix.

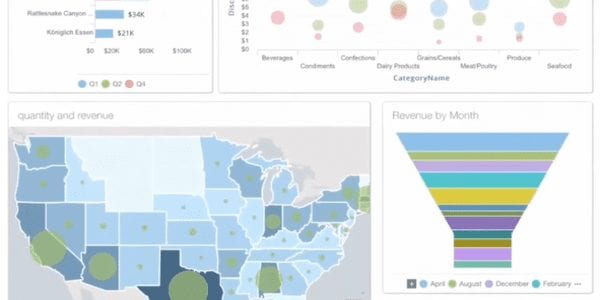
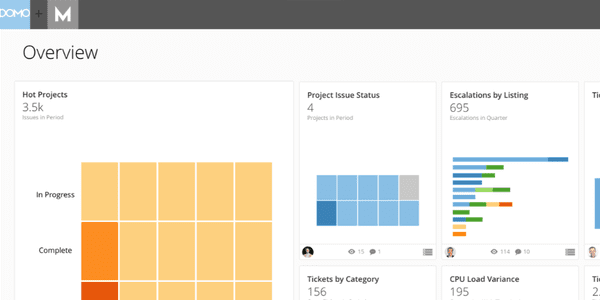
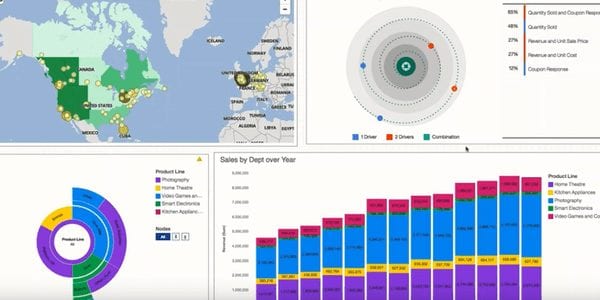
Founded in 2010, Domo was designed to provide access to data without the requirement of IT involvement. Their platform can monitor sales and inventories in real time, and integrate with Salesforce, Google Analytics, Box, LinkedIn, Instagram, among others. Their native data source connectors exceed 500, and their Workbench feature allows you to move on-premise data security using their software. Their platform is highly customizable, and their Analyzer feature can be tailored to filter out unnecessary information.
Specialties: Dashboards, advanced data visualization, graphical reporting
Markets Supported: North America
Key Features:
- DomoBuzz: Provides users the ability to have conversations with others where data resides to more effectively communicate.
- Domo Magic: Enables users to clean data, combine datasets, and transform and prepare data without knowledge of SQL.
- Card Builder: Provides flexible options for data visualization, creative tools, and a simple drag-and-drop interface.
Source: Domo
For an even deeper breakdown of the best data analytics software, consult our vendor comparison matrix.

Hitachi Vantara’s Pentaho data platform is unique because it encompasses data integration and BI and analytic capabilities. The company unveiled Pentaho 8 in last year, adding support for Spark and Kafka to improve stream processing. The update also included security feature add-ons and a way for users to match compute resources with business demands in real-time. Organizations are increasingly deploying Pentaho for embedded use cases.
Specialties: Reporting, data integration, data mining
Markets Supported: North America, EMEA, APAC
Key Features:
- Embedded analytics: The Pentaho platform is purpose-built for embedding into and integrating with applications, portals, and processes.
- Data integration: Data integration allows users to blend, orchestrate, and analyze data from virtually any source.
- Graphical dashboards: Graphical dashboards are web-based and feature a drag-and-drop design that includes rich navigation, drilling, and a library of filter controls.
Source: Hitachi Vantara
For an even deeper breakdown of the best data analytics software, consult our vendor comparison matrix.
IBM offers an expansive range of BI and analytic capabilities under two distinct product lines. The Cognos Analytics platform is an integrated self-service solution that allows users to access data to create dashboards and reports. IBM Watson Analytics offers a machine learning-enabled user experience that includes automated pattern detection, support for natural language query and generation, and embedded advanced analytics capabilities. Cognos is IBM’s ‘flagship’ BI and analytics tool, where Watson is the vendor’s entry into the emerging AI-powered tools arena.
Specialties: Cloud, analytics, IoT
Markets Supported: Global
Key Features:
- Reporting and visualization: IBM’s intuitive interface enables any user to author content on the fly, and dashboards can be created using drag-and-drop on desktop or mobile.
- Data modeling: Users can do data modeling via a completely web-based experience that features direct reporting from data sources and automatic data model generation based on keywords.
- Data governance: Data is protected with layers of permissions, authentication, and history. Data protection controls are including whether a user is creating one report for many or many are creating one report.
Source: IBM
For an even deeper breakdown of the best data analytics software, consult our vendor comparison matrix.

Information Builders is a New York-based solution provider that offers a wide range of BI and data management software tools. The company’s WebFOCUS platform features self-service analytics and data discovery, a visual discovery insight mode, predictive capabilities, and more. WebFOCUS can deploy secure applications to millions of users, and governance functionality enables metadata-driven delivery across an organization. The platform also extends beyond dashboards for executives and analysts by operationalizing data and analytics for line-of-business users.
Specialties: Reporting, data quality, data discovery
Markets Supported: Global
Key Features:
- InfoApps: InfoApps are business-driven analytical apps for non-technical users. They typically focus on a specific business context, and are often embedded within another application’s screen or portal.
- Embedded analytics: WebFOCUS provides embedded analytics via data integration, ease of branding, advanced content options, and security.
- Data discovery: The visual data discovery tool allows non-technical business users to conduct data preparation, visually analyze complex data, generate sophisticated data visualizations, and share content with others.
Source: Information Builders
For an even deeper breakdown of the best data analytics software, consult our vendor comparison matrix.

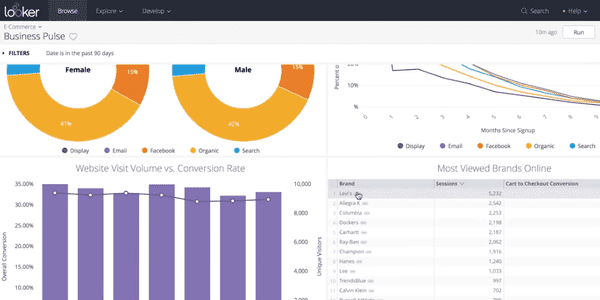
Looker offers a BI and data analytics platform that is built on LookML, the company’s proprietary modeling language. Looker connects to any relational database like Amazon Redshift or Google BigQuery, and automatically generates data models for specific schemas. Users can refine the models to reflect company-specific metrics and business logic to build KPI dashboards and departmental reports. Looker also offers an embedded analytics platform, Powered by Looker.
Specialties: Data discovery, embedded analytics, data culture
Markets Supported: North America, EMEA
Key Features:
- Embedded analytics: Powered by Looker utilizes modern database technologies, and an agile modeling layer allows users to easily define data and control who can access it.
- Data modeling: LookML lets users define specific data models and reference it in other locations.
- Looker Blocks: Looker Blocks are pre-built pieces of code that organizations can leverage to accelerate analytics projects.
Source: Looker
For an even deeper breakdown of the best data analytics software, consult our vendor comparison matrix.

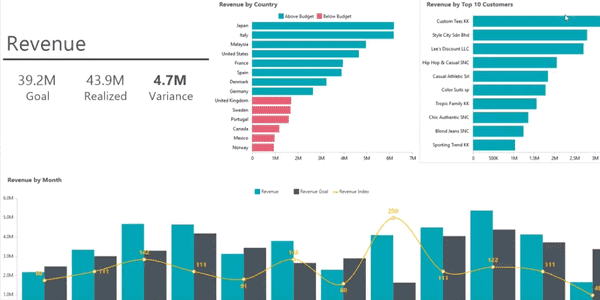
Microsoft is one of a handful of major players in enterprise BI and analytics. The company’s flagship platform, Power BI, is cloud-based and delivered on the Azure Cloud. On-prem capabilities also exist for individual users or when power users are authoring complex data mashups using in-house data sources. Power BI is unique because it enables users to do data preparation, data discovery, and dashboards with the same design tool. The platform integrates with Excel and Office 365, and has a very active user community that extends the tool’s capabilities.
Specialties: Cloud computing, analytics, Office integration
Markets Supported: Global
Key Features:
- Embedded analytics: Power BI offers embedded analytics in two different iterations, first for ISVs and developers, and another for enterprises.
- Self-service BI and enterprise reporting: Power BI Server provides organizations access to SQL Server Reporting Services in a single, on-prem solution.
- Community Support: Microsoft has an expansive web of partners, resellers, and individual users
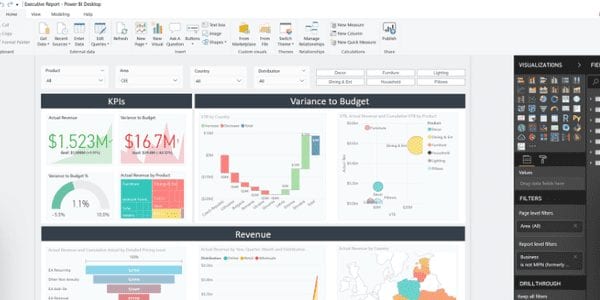
Source: Microsoft
For an even deeper breakdown of the best data analytics software, consult our vendor comparison matrix.

MicroStrategy is a publicly traded BI provider that provides out-of-the-box gateways and native drivers that connect to any enterprise resource, including databases, mobile device management (MDM) systems, enterprise directories, cloud applications, and physical access control systems. The MicroStrategy Platform enables developers and administrators to simplify and accelerate processes at every level of an analytics deployment. A built-in metadata repository stores and catalogs logical business definitions of enterprise data and forms reusable building blocks for every report, dashboard, and application.
Specialties: Enterprise BI, analytics, dashboards
Markets Supported: Global
Key Features:
- Advanced analytics: MicroStrategy provides an extensive library of native analytical functions and scoring algorithms, along with an SDK to integrate with 3rd-party and open source statistical and data mining products.
- Data connectivity: The platform can connect to any enterprise resource, including more than 100 enterprise database and other information assets.
- Data discovery: Organizations can access, explore, and analyze data with self-service analytics.
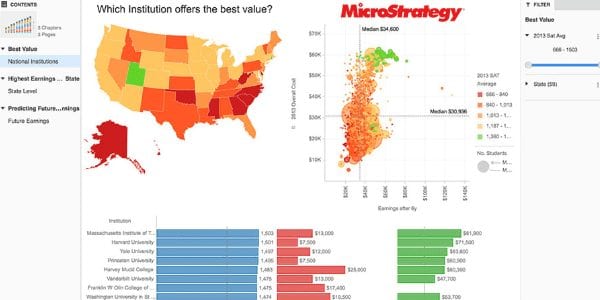
Source: MicroStrategy
For an even deeper breakdown of the best data analytics software, consult our vendor comparison matrix.
Oracle offers a broad range of BI and analytic tools that can be deployed on-prem or in the Oracle Cloud. The company offers traditional BI capabilities inside its Business Intelligence 12c solution. Oracle Data Visualization provides more advanced features, and allows users to automatically visualize data as drag-and-drop attributes, charts, and graphs. The tool also enables users to save snapshots of an analytical moment-in-time via story points. Oracle has greatly expanded their feature capabilities in recent years to include data discovery and data science tools as well.
Specialties: Business intelligence, database software, storage systems
Markets Supported: Global
Key Features:
- Advanced analytics: Oracle extends its database into an advanced analytics platform through two components: Oracle R Enterprise and Oracle Data Mining.
- Data visualization: Oracle Data Visualization provides a simple point-and-click data upload function that allows users to see data visualized automatically.
- Oracle Big Data Discovery: Big Data Discovery allows organizations to find, explore, transform, and analyze big data.
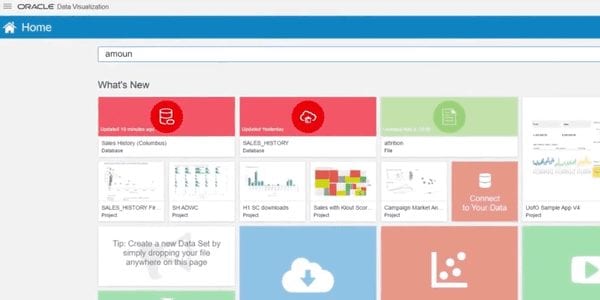
Source: Oracle
For an even deeper breakdown of the best data analytics software, consult our vendor comparison matrix.

Pyramid Analytics offers its data and analytics tool through its flagship platform, Pyramid 2018. The solution touts a server-based, multi-user analytics OS environment that provides self-service capabilities. Pyramid 2018 features a platform-agnostic architecture that allows users to manage data across any environment, regardless of technology. The tool enables those users to prepare, model, visualize, analyze, publish, and present data from web browsers and mobile devices. The company’s product portfolio remains highly integrated with Microsoft’s BI tools, offering an enterprise front end to Microsoft SQL Server Analyses Services (SSAS).
Specialties: Data integration, OLAP, BPM
Markets Supported: North America, EMEA, APAC
Key Features:
- Analytics OS: Pyramid 2018 is an adaptive platform that provides different capabilities and experiences based on user needs and skills.
- Hybrid deployment: The platform can be deployed in any environment.
- Data modeling: Pyramid 2018 features modeling on any ANSI-SQL-compliant source, big data engine, Microsoft engine, or Pyramid’s internal in-memory engine.
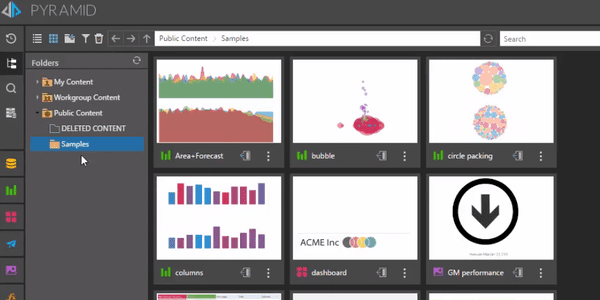
Source: Pyramid Analytics
For an even deeper breakdown of the best data analytics software, consult our vendor comparison matrix.
Qlik offers a broad spectrum of BI and analytics tools, which is headlined by the company’s flagship offering, Qlik Sense. The solution allows organizations to combine all their data sources into a single view. The in-memory engine and associative analytics indexes every possible relationship to data, and the platform is available on-prem (Qlik Sense Enterprise) or in the cloud (Qlik Sense Cloud). Qlik’s product portfolio is rounded out by its Qlik Analytics Platform (embedded and custom tools), and Qlik View, the company’s first-generation data discovery tool.
Specialties: Dashboards, reporting, visual analytics
Markets Supported: Global
Key Features:
- Associative Engine: The in-memory engine allows users to combine an organization’s entire library of data.
- Embedded analytics: The Qlik Analytics Platform allows users to develop, extend, and embed visual analytics in existing applications and portals.
- Data discovery: QlikView allows organizations to create business-driven data discoveries with guided analysis paths that are customizable and tightly governed.
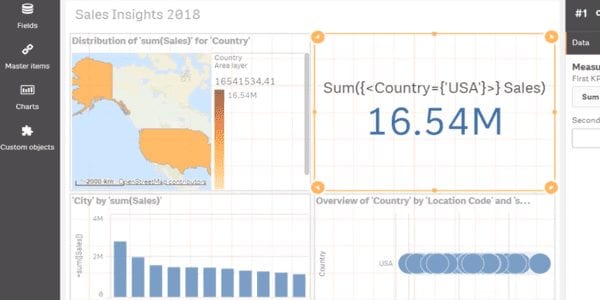
Source: Qlik
For an even deeper breakdown of the best data analytics software, consult our vendor comparison matrix.

SAP offers a broad range of BI and analytics tools in both enterprise and business-user driven editions. The company’s flagship BI portfolio is delivered via on-prem (BusinessObjects Enterprise), and cloud (BusinessObjects Cloud) deployments atop the SAP HANA Cloud. SAP also offers a suite of traditional BI capabilities for dashboards and reporting. The vendor’s data discovery tools are housed in the BusinessObjects solution, while additional functionality, including self-service visualization, are available through the SAP Lumira tool set. SAP is popularly chosen as a company-wide BI standard, especially if an organization also plans to use the company’s application offerings.
Specialties: Analytics, reporting, dashboards
Markets Supported: Global
Key Features:
- Dashboards: BusinessObjects dashboards allow users to personalize drag-and-drop functionality and interactive gauges, charts, and widgets.
- Self-service data visualization: SAP Lumira allows organizations to create interactive maps, charts, and infographics.
- Predictive analytics: SAP offers predictive analytics in both on-prem and cloud versions.
Source: SAP
For an even deeper breakdown of the best data analytics software, consult our vendor comparison matrix.

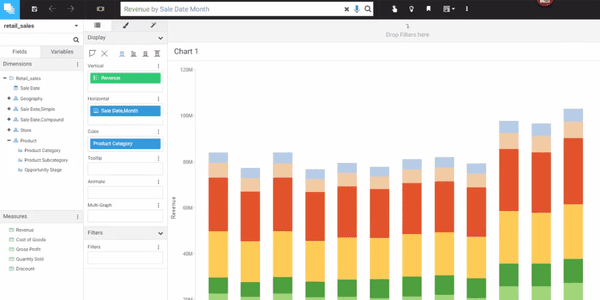
SAS is the largest independent vendor in the BI marketplace. The company’s flagship platform, SAS Visual Analytics, is available on-prem or in the cloud. Visual Analytics allows users to visually explore data to automatically highlight key relationships, outliers, and clusters. Users can also utilize advanced visualizations and guided analysis through autocharting. SAS has made its name as a result of its advanced analytics, as the tool can ingest data from diverse data sources and handle complex models. In addition to BI, SAS offers data management, IoT, personal data protection, and Hadoop tools.
Specialties: Data mining, OLAP, data warehousing
Markets Supported: Global
Key Features:
- Advanced analytics: Dynamic charts and graphs enable fast data interaction via automated and interactive processes that work in both batch and real-time environments.
- Visual data discovery: SAS Visual Analytics provides visual data exploration that automatically highlights key relationships, outliers, and clusters.
- Microservices architecture: SAS Viya is the company’s microservice architecture that will allow users to easily navigate between on-prem cloud data stores and deployments.
Source: SAS
For an even deeper breakdown of the best data analytics software, consult our vendor comparison matrix.

Sisense is a global business analytics software company with offices in New York City, Phoenix, Tokyo, and Tel Aviv. The company’s BI software makes it easy for organizations to reveal business insight from complex data in any size, and from any source. Sisense allows users to combine data and uncover insights in a single interface without scripting, coding or assistance from IT. Their BI and analytics platform is sold as a single-stack solution with a backend for preparing and modeling data. It also features robust analytical capabilities, and a front end for dashboarding and visualization.
Specialties: SQL reporting, big data analytics, Hadoop
Markets Supported: North America, EMEA
Key Features:
- Data preparation: Organizations can prepare, manage, and secure data without supplemental technology or IT involvement.
- Interactive analytics: Sisense turns any user into an analytics expert with advanced capabilities, instant response time, and smart shortcuts.
- Data engine: Sisense hastens data connection so organizations can get up-and-running with ease.
Source: Sisense
For an even deeper breakdown of the best data analytics software, consult our vendor comparison matrix.

Tableau offers an expansive visual BI and analytics platform, and is widely regarded as the major player in the marketplace. The company’s analytic software portfolio is available through three main channels: Tableau Desktop, Tableau Server, and Tableau Online. Tableau connects to hundreds of data sources and is available on-prem or in the cloud. The vendor also offers embedded analytics capabilities, and users can visualize and share data with Tableau Public.
Specialties: Data visualization, data analytics, dashboards
Markets Supported: Global
Key Features:
- Tableau Desktop: Tableau Desktop provides visual data discovery, and connects to big data, an SQL database, or cloud apps like Google Analytics and Salesforce.
- Tableau Server: Tableau Server offers a governed approach to self-service analytics that allows central management of metadata and security rules.
- Tableau Online: Tableau Online is fully hosted in the cloud, so organizations can avoid configuring servers, managing software upgrades, and scaling hardware capacity.
Source: Tableau Software
For an even deeper breakdown of the best data analytics software, consult our vendor comparison matrix.
TARGIT’s flagship BI platform is Decision Suite, an integrated platform that offers visual data discovery, self-service analytics, reporting, and dashboards. The solution features a range of deployment options, and users can access the tool through Windows, web, or mobile clients. Organizations can also embed TARGIT into the applications they use most. TARGIT touts an in-memory database and back-end tool set, which means the platform can be run as a complete end-to-end solution.
Specialties: Reporting, intelligent dashboards, performance management
Markets Supported: North America, EMEA, APAC
Key Features:
- Data integration: TARGIT offers four data integration delivery types: self-service, in-memory databases, multidimensional databases, and direct to data source.
- Embedded analytics: Decision Suite capabilities can be accessed on applications that organizations use most with embedded BI via TARGIT Anywhere.
- Data discovery: TARGIT includes out-of-the-box connectors to CSV, Excel, Google Docs, and more.
Source: TARGIT
For an even deeper breakdown of the best data analytics software, consult our vendor comparison matrix.

ThoughtSpot offers an artificial intelligence-driven analytics platform that features what the company dubs the world’s first relational search engine. The tool combines relational search with a custom-built, in-memory relational data cache to speed up queries that are run over many lines of data. ThoughtSpot connects with any on-prem, cloud, big data, or desktop data source.
Specialties: Data access, data discovery, data preparation
Markets Supported: North America, EMEA, APAC
Key Features:
- Relational Search: Use search to build charts and dashboards for even the most complex queries.
- SpotIQ AI Engine: SpotIQ uses built-in artificial intelligence to run advanced analytics algorithms on many data points and automatically spot insights that are uniquely actionable.
- BI & Visalization Server: Intelligent query generation allows any user to search across complex schemas
using natural language.

Source: ThoughtSpot
For an even deeper breakdown of the best data analytics software, consult our vendor comparison matrix.

TIBCO’s product capabilities are expansive, and range from data integration and API management to visual analytics, reporting, and data science. The company’s BI and analytics portfolio comes in two main iterations: TIBCO Spotfire and TIBCO Jaspersoft. TIBCO Spotfire is the company’s more modern platform. It features interactive visualization, data preparation, enterprise-class governance, and advanced analytic capabilities. TIBCO Jaspersoft supports traditional reporting and embedded BI functionality.
Specialties: Predictive analytics, data visualization, in-memory analytics
Markets Supported: Global
Key Features:
- AI-driven search and data discovery: Spotfire Smart Data Catalog allows users to visually interact with data to automatically discover relationships, sentiments, and recommendations via built-in artificial intelligence.
- Data access: Users can connect to and blend data from files, relational and NoSQL databases, OLAP, Hadoop, and web services.
- Big data analytics: TIBCO’s Insight Platform combines live streaming data with queries on large-at-rest volumes.
Source: TIBCO Software
For an even deeper breakdown of the best data analytics software, consult our vendor comparison matrix.

Yellowfin is an Australia-based BI and analytics company that specializes in providing organizations with dashboards and data visualization capabilities. Their platform features a machine learning algorithm called Assisted Insights that provides automatic answers in the form of easy-to-understand best practice visualizations and narratives. Yellowfin comes pre-built with a variety of dashboards, and users can embed interactive reports into third-party platforms, such as a web page, wiki, or company intranet. The company also offers native apps for mobile devices.
Specialties: Embedded BI, mobile BI, location intelligence
Markets Supported: North America, EMEA, APAC
Key Features:
- Assisted Insights: Machine learning capabilities included inside Yellowfin provide immediate answers without the user having to dig through data.
- Dashboards: Yellowfin allows users to see all their different data sources in one dashboard with high-level summary reports and KPIs.
- Data visualization: Yellowfin includes more than 50 chart types, from trellis charts to GIS maps and infographics.
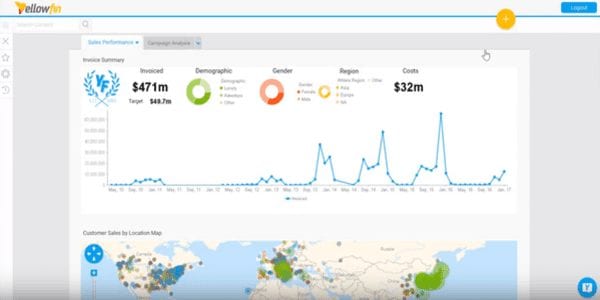
Source: Yellowfin BI
For an even deeper breakdown of the best data analytics software, consult our vendor comparison matrix.

Zoomdata offers a range of BI and analytic tools highlighted by big data exploration and data visualization. The platform features a patented micro-query architecture that allows organizations to bridge old and new data in a single pane of glass. Zoomdata enables connection, interaction, and visualization with data on browsers and mobile devices. The company’s DataDVR capabilities allow users to fast-forward, rewind, and compare real-time streaming and historical data as well.
Specialties: Big data analytics, embedded BI, data visualization
Markets Supported: North America, EMEA, APAC
Key Features:
- Big data discovery: Zoomdata’s micro-query architecture provides results on billions of records and gives users a single pane of glass for bridging old and new data.
- DataDVR: DataDVR lets users interact with data the same way they would use streaming video technology to interact with live video or replay movies.
- Multi-source analysis: Zoomdata Fusion enables interactive blending and analysis across disparate data sources, bridging modern and legacy data architectures, combining real-time streams and historical data, and unifying enterprise data on-prem and in the cloud.
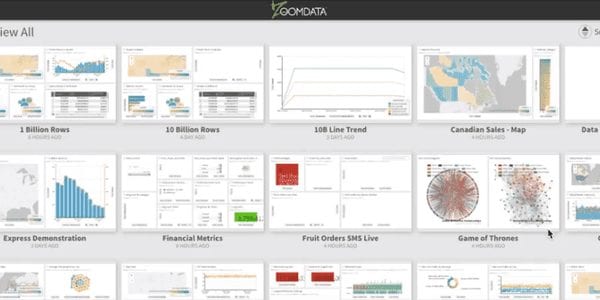
Source: Zoomdata
For an even deeper breakdown of the best data analytics software, consult our vendor comparison matrix.

Tim King
Executive Editor
Tim is Solutions Review's Executive Editor covering the human impact of AI on the future of work and learning. He is also the Media Strategist behind Insight Jam (1M+ on YouTube) events and programming. A 2017 and 2018 Most Influential Business Journalist and 2021 "Who's Who" in multiple categories, Tim is a recognized thought leader in enterprise tech and AI.
- Analytics and Data Science News for the Week of June 26; Updates from Databricks, Dataiku, WisdomAI & More - June 26, 2026
- Analytics and Data Science News for the Week of June 19; Updates from Databricks, Gartner, Qrvey & More - June 19, 2026
- Analytics and Data Science News for the Week of June 12; Updates from Databricks, Dataiku, Golden Analytics & More - June 12, 2026