This is part of Solutions Review’s Premium Content Series, a collection of contributed columns written by industry experts in maturing software categories. In this submission, Cherre Data Scientist Davida Kollmar offers a knowledge graph definition and 101 resource for those evaluating vendors and tools in the marketplace.
 If data does not have context, it’s easy to miss relationships between different data points. Making these links at a glance can be especially difficult if the data comes from different sources. The task of creating these associations is what makes Knowledge Graphs so important. These graphs collect and connect data, putting it into context so that it is actually useful for decision-making. They allow us to model entities and their relationships.
However, while Knowledge Graphs are one of the hottest areas of data science research, they continue to remain underutilized in the business world, which is why it’s important to understand what makes up a knowledge graph, how they work, the different types of knowledge graphs, and their benefits.

Knowledge Graph Definition
The Anatomy of a Knowledge Graph
It’s best to start with the basics. A graph is a mathematical structure used to model entities and their relationships. Graphs are made up of nodes and edges. Nodes, also called vertices or points, represent the entities for which we are finding the relationships for. Edges, also called links, connect two nodes when a relationship exists between them.
As an example, let’s look at the graph below. The graph has nodes A, B, C, and D. There are edges connecting A&B, A&C, B&C, and C&D.
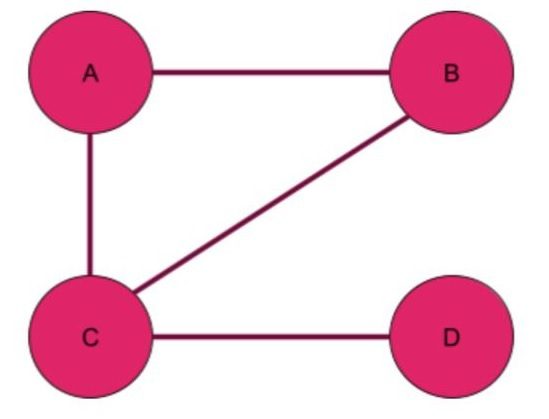
The nodes and edges in the graph can represent anything we want them to. For instance, a graph of social media users would have nodes corresponding to users, and an edge between nodes would mean that those users are “friends.” A graph representing the World Wide Web would have webpages as nodes and edges corresponding to hyperlinks between pages.
Now let’s talk about some ways of classifying graphs.
Undirected vs Directed Graphs
Graphs can be undirected or directed.
In an undirected graph, the edges in the graph represent a two-sided relationship, where the relationship going from the first node to the second is the same as the relationship going between the second node and the first. Using LinkedIn as an example, an undirected graph would represent users who have “connected” with each other – this is a reciprocal relationship.
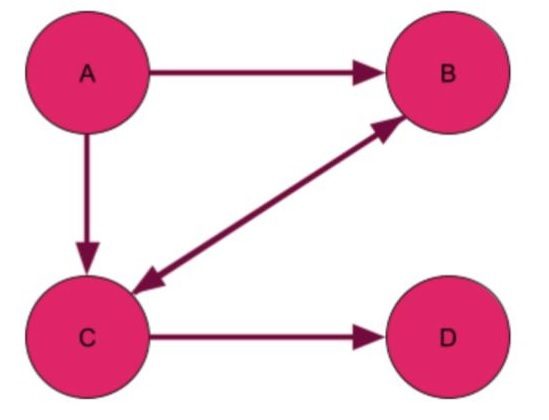
In a directed graph, the edges have a direction. The relationship from A to B is not necessarily the same as the relationship from B to A. In Twitter, a directed edge would represent a “follower” relationship – I may follow you, but you might not follow me back. Below is a diagram of what a directed graph would look like. Instead of representing the edges by lines, they’re represented by arrows that give the direction of the relationship.
Unweighted vs Weighted Graphs
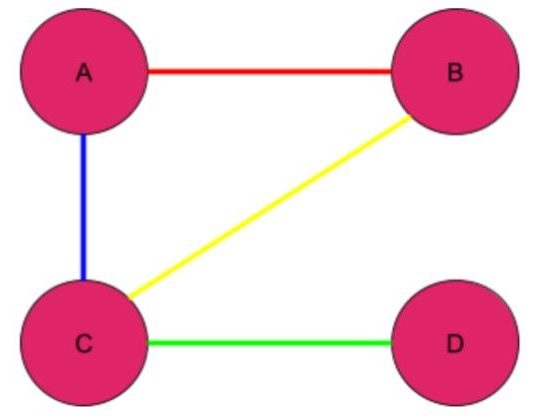
Another way of classifying graphs is by whether they are unweighted or weighted. In an unweighted graph, all edges have the same weight. In a weighted graph, each edge is associated with a number representing its weight.
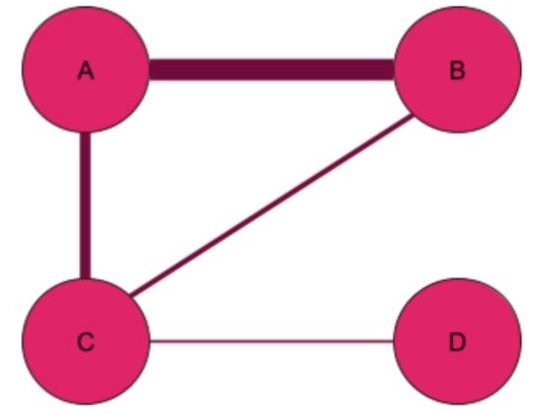
In a social network, the weights might correspond to the strength of a connection: The higher the weight, the stronger the connection between the nodes. You may have a stronger connection with your teammate, but a weaker connection with a person you met at a conference. In a graph of roads and intersections, the weight might represent a road’s capacity. Below is a diagram of a weighted graph, where a thicker line represents an edge with a larger weight.
Homogeneous vs Heterogeneous Graphs
The graphs discussed so far have been examples of homogeneous graphs. In homogeneous graphs, all nodes have the same type, as do all edges. For example, in a typical social network, all nodes have the same type (they all represent people), and we do not distinguish between types of friendships.
There are also graphs that are heterogeneous in nature. In a heterogeneous graph, nodes can be of different types, and there can be different types of edges between them. For example, let’s take a graph of the employees of a company. We could have one type of edge corresponding to when employees are teammates and another type of edge corresponding to when employees are managers/direct reports. In the diagram below, we distinguish between different types of edges by using different colors.
Knowledge Graphs
So, what is a knowledge graph, and why are they important?
If we simplify the definition of knowledge to a collection of facts, then knowledge about a given domain can be well represented by a heterogeneous graph. Many facts can be written in the form of two entities involved in some type of relationship. For example, the fact that Angelina Jolie and Brad Pitt used to be married can be represented as two nodes (one for Angelina Jolie, and another for Brad Pitt) connected with an edge.
Edges and nodes can also have features that encode even more information about the relationship. Features of the edge between Angelina Jolie and Brad Pitt would include its type (“married”), the timestamp of the start of the relationship, and the timestamp of its end.
If we connect the node representing Angelina Jolie with a node representing her father Jon Voight, we could use the resulting graph to infer that Brad Pitt was Jon Voight’s son-in-law. Thus, by traversing the graph, we make conclusions which are not directly represented as edges connecting nodes.
A knowledge graph with many (millions of) nodes and their relationships can represent an entire branch of knowledge. That’s the power of a knowledge graph: this collection of connected relationships, events, and entities puts data into context and provides a framework for use.
A more practical knowledge graph example can be found in the real estate industry. In Cherre’s real estate knowledge graph, node types are properties and addresses, as well as people, companies, governmental organizations, and educational institutions involved in the real estate market.
An edge between a property and an address indicates that the property is located at that address. Note that there might be multiple properties associated with the same address, and multiple addresses associated with the same property. An edge between a property and a person would mean that the person owns the property. An edge between an address and a person would mean that the person receives mail at that address.
The edges can also have weights, based on how many times a connection is seen in data sources. These different characteristics are illustrated in the diagram below.
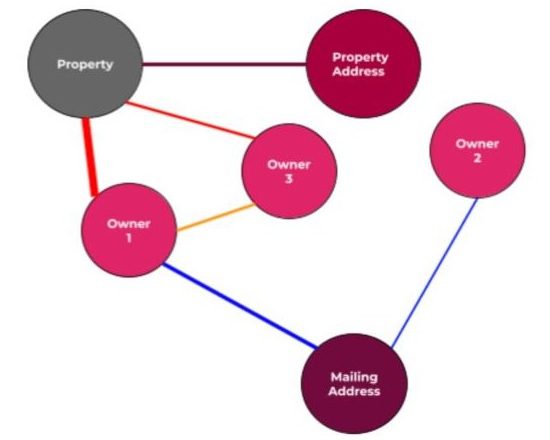
The nodes and edges both have features. For nodes representing owners, for example, features would include the name of the owner that the node represents and the state in which the owner is located. Features on our edges include the source in which the connection between the entities was established and the timestamps of the first and most recent occurrences of the connection.
Benefits of Knowledge Graphs
Knowledge Graphs are able to combine siloed data from various sources together, whether that be different sources of internal data (such as departments in a company) or internal data with external data. They can also merge different types of structured and unstructured data. The creation of Knowledge Graphs enables organizations to create a single source of truth and create connections between data. The ability to surface new patterns and visualize underlying relationships is key to gaining deeper insights from existing data. Knowledge Graphs make data more valuable and enable true “data-driven decision-making.”

Davida Kollmar
Davida Kollmar is a data scientist at Cherre, where she leverages the world's largest real estate knowledge graph for applications such as owner unmasking. Prior to her time at Cherre, Kollmar earned a Master of Science in data science at New York University's Center for Data Science.