Tableau 2020.2 Touts a New Data Model, Metrics for KPI Monitoring
-
 By
Tim King
, Executive Editor at Solutions Review
By
Tim King
, Executive Editor at Solutions Review - Business Intelligence News,
Source: Tableau Software
Tableau Software has announced the release of Tableau 2020.2, the latest version of its flagship business intelligence and data analytics platform. The update brings a new data model that simplifies advanced analysis of complex data with no coding or scripting skills required. The release also includes a new mobile-friendly way for customers to monitor key performance indicators (KPIs) called Metrics, as well as fresh connectors for geospatial data. Tableau 2020.2 builds off its previous release that saw the popular product receive Dynamic Parameters and Viz Animations.
One of four major players in enterprise BI and analytics, Tableau offers an expansive visual platform. Its analytic software portfolio is available through three main channels: Tableau Desktop, Tableau Server, and Tableau Online. Tableau connects to hundreds of data sources and is available on-prem or in the cloud. The vendor also offers embedded analytics capabilities, and users can visualize and share data with Tableau Public.
Tableau’s new data modeling capabilities simplify the process of analyzing data across multiple tables at different levels of detail. Users can create relationships between tables that automatically create accurate aggregations. Relationships also make queries more efficient and data sources easier to maintain by only querying relevant tables to improve dashboard performance. Multiple levels of detail are preserved in a single data source with industry-standard star and snowflake schema support.
The Metrics feature provides an easy way to monitor KPIs by offering a custom, at-a-glance view of critical data, streamlined to one location. Metrics are accessible from the Tableau Mobile app via push notifications or in the browser. This kind of functionality lets users move beyond needing to view multiple dashboards or adjust filters to see up-to-date data. Tableau says this KPI view is “as easy to understand as checking a bank account balance” online.
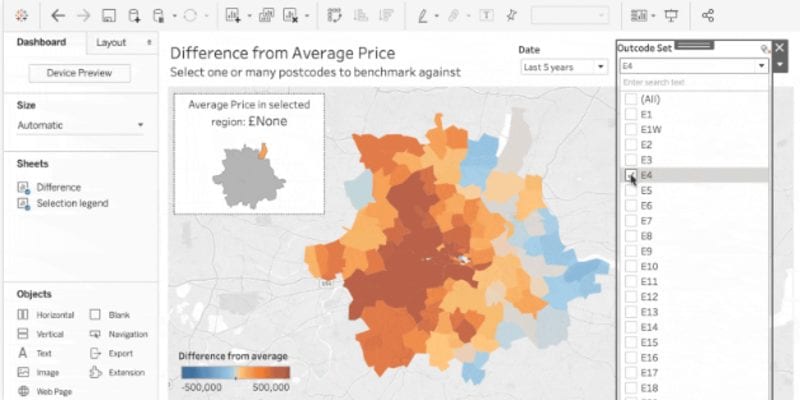
Other new additions to Tableau 2020.2 are highlighted by Esri ArcGIS support via a simple connection experience that lets customers ask and solve for more location-based questions. Users can also create custom suggestions to give others more relevant prompts so they can use data roles to add semantic context across data sources. Tableau Prep Builder is a direct connection to customer Salesforce data while Tableau Catalog ensures customers are using the most trusted data with new High Visibility Data Quality Warnings.
In a media statement about the release, Tableau’s Chief Product Officer Francois Ajenstat said: “With new data modeling capabilities, Tableau 2020.2 reduces the effort needed to analyze even the most complex datasets and simplifies analysis for anyone, regardless of expertise. In addition, Metrics enables everyone to instantly access the most vital data at their fingertips so they can make better decisions about their business from anywhere.”
Learn more about the new features included in Tableau 2020.2.

Tim King
Executive Editor
Tim is Solutions Review's Executive Editor covering the human impact of AI on the future of work and learning. He is also the Media Strategist behind Insight Jam (1M+ on YouTube) events and programming. A 2017 and 2018 Most Influential Business Journalist and 2021 "Who's Who" in multiple categories, Tim is a recognized thought leader in enterprise tech and AI.
- Analytics and Data Science News for the Week of July 17; Updates from Anaconda, Databricks, LatentView & More - July 17, 2026
- Forecast Accuracy Requires More Than Financial Data - July 16, 2026
- Analytics and Data Science News for the Week of July 10; Updates from Actian, Dun & Bradstreet, Gartner & More - July 10, 2026