Categorical Data vs. Quantitative Data; What’s the Difference?


This is part of Solutions Review’s Premium Content Series, a collection of contributed columns written by industry experts in maturing software categories. In this submission, thatDot COO Rob Malnati compares categorical data vs. quantitative data so you know the difference.
 With all the talk about how valuable data is (it is the new oil, after all), you might be forgiven if you think enterprises are doing all they can to capture and extract value from every precious byte. But that’s simply not the case.
In fact, according to some estimates, as much as 95 percent of the data generated by businesses goes unprocessed, generating no value; worse, 70 percent of it is discarded, meaning the opportunity to derive value is lost forever.
Why? Because, like oil, there are different types of data – the most basic being quantitative (often called numerical) and categorical data – and each requires different tools to process. And because most enterprises lack those tools, particularly for categorical data, a surprising amount of data gets thrown away.
Below we look at the difference between categorical and quantitative data, the challenges of processing both, and how leaders can evolve their tools and processes to make the most out of the abundance of data.
Quantitative Data vs. Categorical Data
Quantitative data includes any calculable or measurable information that can be operated on mathematically. Quantitative data can describe the physical world – weights and measures – or model the hypothetical world with statistical analysis. Bank balances, air temperatures, and polling data are all quantitative.
Categorical data, on the other hand, is descriptive and conceptual and cannot be directly manipulated with mathematical operations. Colors, product models, and email addresses are common examples. Your bank account number, describing the weather as hot, mild, or cold, and classifying the results of a poll in order of results are all categorical data.

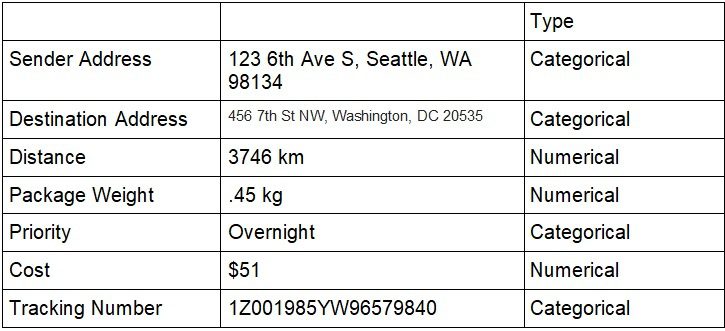
Very few applications or processes can be understood using only one type of data. For example, think about just a fraction of the data created when shipping a package from Seattle to Washington, DC:

It seems evident that without both quantitative and numerical data, one can’t fully understand let alone analyze this data. Both types of data are needed. And yet, when it comes to analyzing large amounts of mixed data – whether in SIEM tools like Splunk or using common machine learning algorithms – the tools are almost entirely skewed toward processing quantitative data.
Current Challenges of Processing Categorical Data
There are two widely available means of processing categorical data: turning it into numbers using encoding techniques like “one-hot” or full-text search systems.
A quick search for “categorical data” in the documentation of leading databases, data lakes, and SIEM providers indicates how pervasive this approach is. Encoding rarely works well in conveying important information that we can immediately detect, like gradations of intensity (chilly vs. cool or hot vs. scorching) or relationships (kitten to cat; login attempt to account).
Text search is the most common way to work with categorical data types. However, while it is well-suited for finding a specific pattern of characters within files, search is best for data retrieval and basic quantitative analytics (e.g., counts of terms). The terms kitten and cat in the context of search are as different as the terms kitten and cobalt.
What is lacking is a way to organize and understand categorical data the way humans think: to express causality, progression, ordinality, and degree of difference.
The value of most data is time sensitive. While we can learn from historical data, our world moves rapidly, and we need instant decision-making. Legacy data processing needs to shift into real-time now more than ever.
In the past, the data processing tools on the market have excelled at processing one type of data over the other, transforming the data and taking a long time to process large volumes. Enterprises need to focus on what results and information they are trying to garner from this influx of data and choose a tool that can keep up with the volume and demand for real-time analysis.
Keep an eye out for part two of this series, where I will dive deeper into the best types of tools and processes to organize your data, categorical, quantitative, or hybrid.


