What’s Changed: 2019 Gartner Magic Quadrant for Analytics and Business Intelligence Platforms
-
 By
Tim King
, Executive Editor at Solutions Review
By
Tim King
, Executive Editor at Solutions Review - Business Intelligence News,
Analyst house Gartner, Inc. recently released the 2019 version of its Magic Quadrant for Analytics and Business Intelligence Platforms. Augmented analytics remains a key driver of this software market, a topic that the researcher has really been hammering during the last year. Gartner believes that automation will be the dominant driver of new purchases by next year for both business intelligence and analytics, as well as data science and embedded BI. Gartner is also predicting that half of all analytical queries will be generated via search, automation, natural language or voice during this span.
Increased use of natural language processing and conversation analytics will enable a new swath of users to take advantage of BI and analytics, so much so that Gartner is expecting a 15 percent increase in adoption among enterprise organizations. Front-office workers are projected to benefit the most, and data and analytics users inside business units will grow exponentially at the expense of those in IT. Gartner analysts think this fact will pressure forward-thinking companies to restructure their organizational models in the near-term.

Gartner’s market definition hasn’t changed all that much, as modern analytics and BI software should support the complete analytic workflow from data preparation to ingestion and visual exploration. The report authors add: “They are most differentiated from traditional BI platforms by not requiring significant involvement from IT staff to predefine data models or store data in traditional data warehouses. Most modern analytics and BI platforms also have their own self-contained in-memory columnar engine to ensure fast performance and support rapid prototyping, but many can optionally use existing modeled data sources.”
The report correctly outlines the evolution of ‘modern’ analytics and BI over the last five years. Not only are traditional reporting platforms being challenged by the proliferation of augmented analytics and machine learning, but so too are the visual-based data discovery providers. Gartner notes that those at the forefront of natural language processing and narrative generation are able to command a higher price tag for their products than the competition.
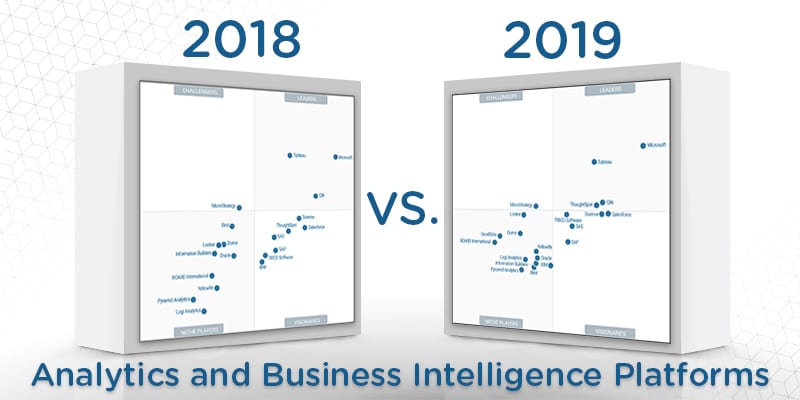
In this Magic Quadrant, Gartner evaluates the strengths and weaknesses of 21 providers that it considers most significant in the marketplace, and provides readers with a graph (the Magic Quadrant) plotting the vendors based on their ability to execute and their completeness of vision. The graph is divided into four quadrants: niche players, challengers, visionaries, and leaders. At Solutions Review, we read the report, available here, and pulled out the key takeaways.
Last year saw Microsoft and Tableau in a virtual tie for control over the space. This year, however, Microsoft has put some space between itself and its top competitor, improving its standing on Gartner’s vertical ‘ability to execute’ axis. Microsoft offers excellent functionality for the price, and its users are able to run complex analysis with relative ease. It will remain the top player for years to come. Tableau’s cushy status comes as a result of its popular data visualization product and strong reference customer ratings. The company recently unveiled new natural language processing and automated data preparation functionality.
Qlik also retained its leadership status due to what Gartner refers to as a strong product roadmap, and the vendor’s geographic reach gives it a leg up on some of the other providers in the space. The company entered the broader data management market in 2018 with its acquisition of Podium Data, and released a new Associative Data Index in September. As we predicted earlier this month, ThoughtSpot is now a market leader. It comes as little surprise, as the Palo Alto-based provider is leading the charge in the augmented analytics revolution. ThoughtSpot began the year by raising $145 million in new venture capital. Then in November, the vendor released ThoughtSpot 5, which is highlighted by a new voice-driven analytics interface called SearchIQ.
The challengers bracket once again belongs to MicroStrategy. Its investment in augmented analytic capabilities is a welcomed sight, and reference customers score it highly for product capabilities. The product also allows for complex analysis of large data volumes and is best for enterprise deployments. The company recently released an update to its flagship offering, adding what it dubs “a new class of enterprise intelligence” called HyperIntelligence.
TIBCO Software, Sisense and Salesforce are in a virtual tie for the top spot in the visionaries column, and are all within striking distance of becoming leaders in 2020. TIBCO improved the most, due in large part to its recent acquisition spree that has allowed them to better compete in data science, hybrid data integration and master data management. The company also updated its embedded analytics product and released an AI-driven analytics tool called Spotfire X in 2018. Sisense brought its total funding earned up to $200 million with a November capital investment, signaling its interest in pursuing enterprise-level customers. The company also made a commitment to machine learning and unveiled a new Data Cognition Engine that learns large datasets and can produce microsecond analytical responses in October.
The niche players bracket has a different feel than in year’s past, and consists of more traditional BI providers (Oracle, IBM, Information Builders, BOARD International) and those that offer embedded analytics (Logi Analytics, GoodData). A position among in the niche players column has little meaning, other than that each provider is highly specialized in a specific area. Buyers are advised to consider this while consulting vendors. Looker saw the most noticeable increase in standing in this column, and finished the year with an impressive growth funding round worth $100 million. The company also released new integrations for data science workflows, department-specific apps and developer tools in Looker 6, and an integration with google BigQuery in 2018.
Read Gartner’s Magic Quadrant.

Tim King
Executive Editor
Tim is Solutions Review's Executive Editor covering the human impact of AI on the future of work and learning. He is also the Media Strategist behind Insight Jam (1M+ on YouTube) events and programming. A 2017 and 2018 Most Influential Business Journalist and 2021 "Who's Who" in multiple categories, Tim is a recognized thought leader in enterprise tech and AI.
- Analytics and Data Science News for the Week of June 26; Updates from Databricks, Dataiku, WisdomAI & More - June 26, 2026
- Analytics and Data Science News for the Week of June 19; Updates from Databricks, Gartner, Qrvey & More - June 19, 2026
- Analytics and Data Science News for the Week of June 12; Updates from Databricks, Dataiku, Golden Analytics & More - June 12, 2026