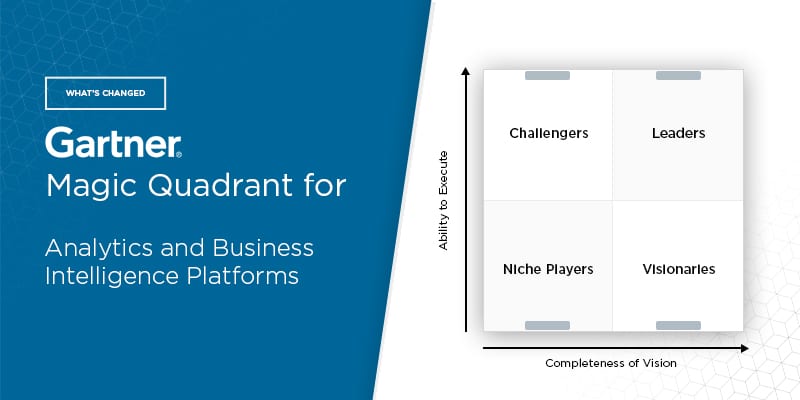
What’s Changed: 2020 Gartner Magic Quadrant for Analytics and Business Intelligence Platforms
-
 By
Tim King
, Executive Editor at Solutions Review
By
Tim King
, Executive Editor at Solutions Review - Business Intelligence News,
The editors at Solutions Review highlight what’s changed since the last iteration of Gartner’s Magic Quadrant for Analytics and Business Intelligence Platforms and provide analysis of the new report.
Analyst house Gartner, Inc. has released its 2020 Magic Quadrant for Analytics and Business Intelligence Platforms. Augmented analytics continues to be the key driver for buyers in this software market. The cloud is also a major consideration for organizations evaluating their options for BI and analytics. The researcher notes that most new spending is on BI software in cloud deployments. The market remains extremely mature, with larger vendors offering more broad analytic portfolios and well-funded startups filling in the gaps or niche use cases.
2019 saw a mass exodus to the cloud, or, as Gartner puts it, a year of “transition toward cloud ecosystem dominance.” Gartner analysts add: “The rapid growth of the Microsoft Azure-based Power BI cloud service, along with Salesforce’s acquisition of Tableau and Google’s purchase of Looker, signaled a change whereby cloud stacks are now expected to come with a competitively priced ABI platform.” Buyers should consider vendor lock-in, as well as whether or not multicloud is in their immediate plans during vendor selection. Analytics and BI providers are increasingly having to decide between opening their products or focus on specific market segments and aligning their marketing and products to those verticals.
Though embedded augmented BI solutions have a different set of buyers on the whole, Gartner considers these tools as one of the major use cases currently. Several of the companies featured in this Magic Quadrant look to the embedded use case as representative of their primary market. For other providers it remains a limited focus, but one that represents a new way of competing with their peers. Embedded analytics also requires improved APIs and detailed pricing models.

Gartner adjusts its evaluation and inclusion criteria for Magic Quadrants as software markets evolve. As a result, Alibaba Cloud and Dundas have been added to the report. GoodData was removed for no longer meeting the Tier 1 market traction criterion.
In this Magic Quadrant, Gartner evaluates the strengths and weaknesses of 22 providers that it considers most significant in the marketplace, and provides readers with a graph (the Magic Quadrant) plotting the vendors based on their ability to execute and completeness of vision. The graph is divided into four quadrants: niche players, challengers, visionaries, and leaders. At Solutions Review, we read the report, available here, and pulled out the key takeaways.
Microsoft is the market leader in analytics and business intelligence software, once again occupying the top spot in this Magic Quadrant. After pulling away from Tableau on the horizontal axis in 2019, the two providers are back to dueling it out for supremacy in this software category. Microsoft offers a complete portfolio of modern analytic capabilities like data preparation, visual data discovery, interactive dashboards and augmented functionality in Power BI. Tableau enhanced its augmented BI suite last year and is a top choice for visual-based data exploration and data visualization. Tableau’s June acquisition by Salesforce muddies the vendor’s product roadmap some, however.
Qlik and ThoughtSpot round out the 2020 leaders column. Qlik retains its slight edge in ability to execute over the search-based AI analytics provider, but only by a small margin. Qlik offers strong machine learning and AI-centric capabilities in Qlik Sense, its modern BI product. Qlik had a busy year after acquiring Attunity in February. The provider also released a set of multi-cloud augmented BI features and new natural language functionality in October. After raising a quarter-billion dollars in new venture funding in August, ThoughtSpot unveiled ThoughtSpot 6 in October featuring enhanced data access and automated analytic capabilities. ThoughtSpot’s search-based user interface supports complex questions and is one of the most unique solutions in the space.
MicroStrategy headlines the challengers quadrant and its position on both Magic Quadrant axes is improved from 2019. Its augmented analytics platform is complete and data connectivity, visualization and advanced analytics are boosted by mobile, cloud and embedded analytics functionality. The provider recently released MicroStrategy 2020 with new HyperIntelligence capabilities that provide insight with ‘zero clicks.’ Unlike 2019, MicroStrategy has company in this bracket in the form of TIBCO Software and Looker.
TIBCO Software made the jump up from its 2019 position among analytics and BI visionaries. TIBCO Spotfire offers strong dashboard analytics, interactive data visualization and data preparation. Its Spotfire X product features augmented BI in the form of data science techniques and NLQ and NLG add-ons. Recently released Spotfire enhancements are buoyed by interactive analytics for large-scale data volumes in Google BigQuery and Apache Spark. As we predicted last month, Looker made the leap from its status as a niche player last year to challenger for 2020. Its acquisition by Google in June does create some uncertainty, though as Gartner notes, it also massively increases Looker’s visibility in the space. 2019 Looker platform updates include a suite of sales analytics and developer tools, as well as new application marketplace and multi-cloud hosting in Looker 7.
Yellowfin made one of the largest moves of any vendor in this Magic Quadrant, all the way from 2019 niche player to 2020 visionary in the upper left-hand portion of Gartner’s graphic. Yellowfin has made great strides in product innovation that are among the best in the industry. In addition to a new mobile app, Yellowfin 9 (released in November) includes new dashboard and presentation tools. Oracle made a similar voyage and now holds the top ability to execute score among visionaries. Oracle simplified its line of analytics and BI software under the Oracle Analytics banner in 2019. The re-branded suite includes more than 18 different tools.
Sisense retains its strong standing among visionaries even if it is now facing increased competition. Its augmented analytics solution includes data preparation and visual exploration, with many customers using it as an embedded product. Sisense acquired Periscope Data in May and released its first integrated solution in December. It also secured $100 million new funding at a billion-dollar valuation last month. SAS and SAP are tightly clustered in this space as well and SAP saw a small improvement in its standing on Gartner’s horizontal axis this year. SAS recently added new AI and machine learning tools to its flagship platform. Significant investment in augmented analytics has SAS’s arrow pointing up for 2020.
Information Builders holds the top spot among niche players for 2020. Its WebFOCUS platform is best for large-scale deployments and includes support for complex data and a number of sources. Information Builders released a cloud-optimized version of this product in November. Domo retains its position in the middle of this quadrant, offering top features for ease of use and business user dashboards. Its cloud-based executive management product touts more than 1,000 connectors and a low-to-no code framework for line-of-business professionals. Domo released a SaaS product called Domo Integration Cloud in February.
Pyramid Analytics saw its horizontal positioning regress in a positive manner, and now finds itself clustered with BOARD International and Logi Analytics in the upper-third of the quadrant. According to Gartner, its presence is growing due to offering on-prem, private cloud or hybrid deployment methods. Its September release of Pyramid v2020 brings a focus on ease of use via a simplified interface, as well as a new feature called Analytics for Everyone which provides two new discovery environments that compliment the Discover mode. BOARD is best for doing BI in financial settings. BOARD 11 (released in May) features an enhanced in-memory calculation engine that replaces its MOLAP approach. Logi Analytics is an embedded BI provider. It acquired Jinfonet Software and Zoomdata in 2019 before releasing Logi Predict 3.0 in May.
Birst and IBM also improved their respective vertical placements in the 2020 Magic Quadrant. Birst offers a cloud-based, end-to-end platform for data warehousing, reporting and data visualization. It currently operates as a standalone division of Infor (acquired in 2017) with a majority of its users being Infor customers. Birst 7 was released in May and features a new user interface, upgraded data modeling experience, and a new administration module with auditing. IBM’s Cognos Analytics supports the entire analytic process. The product has also been updated to include augmented capabilities like time series forecasting, key driver detection and NLP and NLG. We expect IBM to join Oracle and SAP as visionary analytics and BI platforms for 2021.
Read Gartner’s Magic Quadrant for Analytics and Business Intelligence Platforms.

Tim King
Executive Editor
Tim is Solutions Review's Executive Editor covering the human impact of AI on the future of work and learning. He is also the Media Strategist behind Insight Jam (1M+ on YouTube) events and programming. A 2017 and 2018 Most Influential Business Journalist and 2021 "Who's Who" in multiple categories, Tim is a recognized thought leader in enterprise tech and AI.
- Analytics and Data Science News for the Week of June 26; Updates from Databricks, Dataiku, WisdomAI & More - June 26, 2026
- Analytics and Data Science News for the Week of June 19; Updates from Databricks, Gartner, Qrvey & More - June 19, 2026
- Analytics and Data Science News for the Week of June 12; Updates from Databricks, Dataiku, Golden Analytics & More - June 12, 2026